Quantitative Trading Framework
A modular backtesting platform with cached data pipelines and an interactive dashboard. I test momentum and mean-reversion strategies against transaction costs, out-of-sample periods, and walk-forward validation.
- Backtrader
- QuantStats
- yfinance
- Alpha Vantage API
- SQLite
- Plotly Dash
- Out-of-sample Sharpe
- 0.86
- In-sample Sharpe
- 1.18
- Walk-forward folds
- 7
- Tests
- 53
Measured in testing, not in live production.
The backtest that fooled me
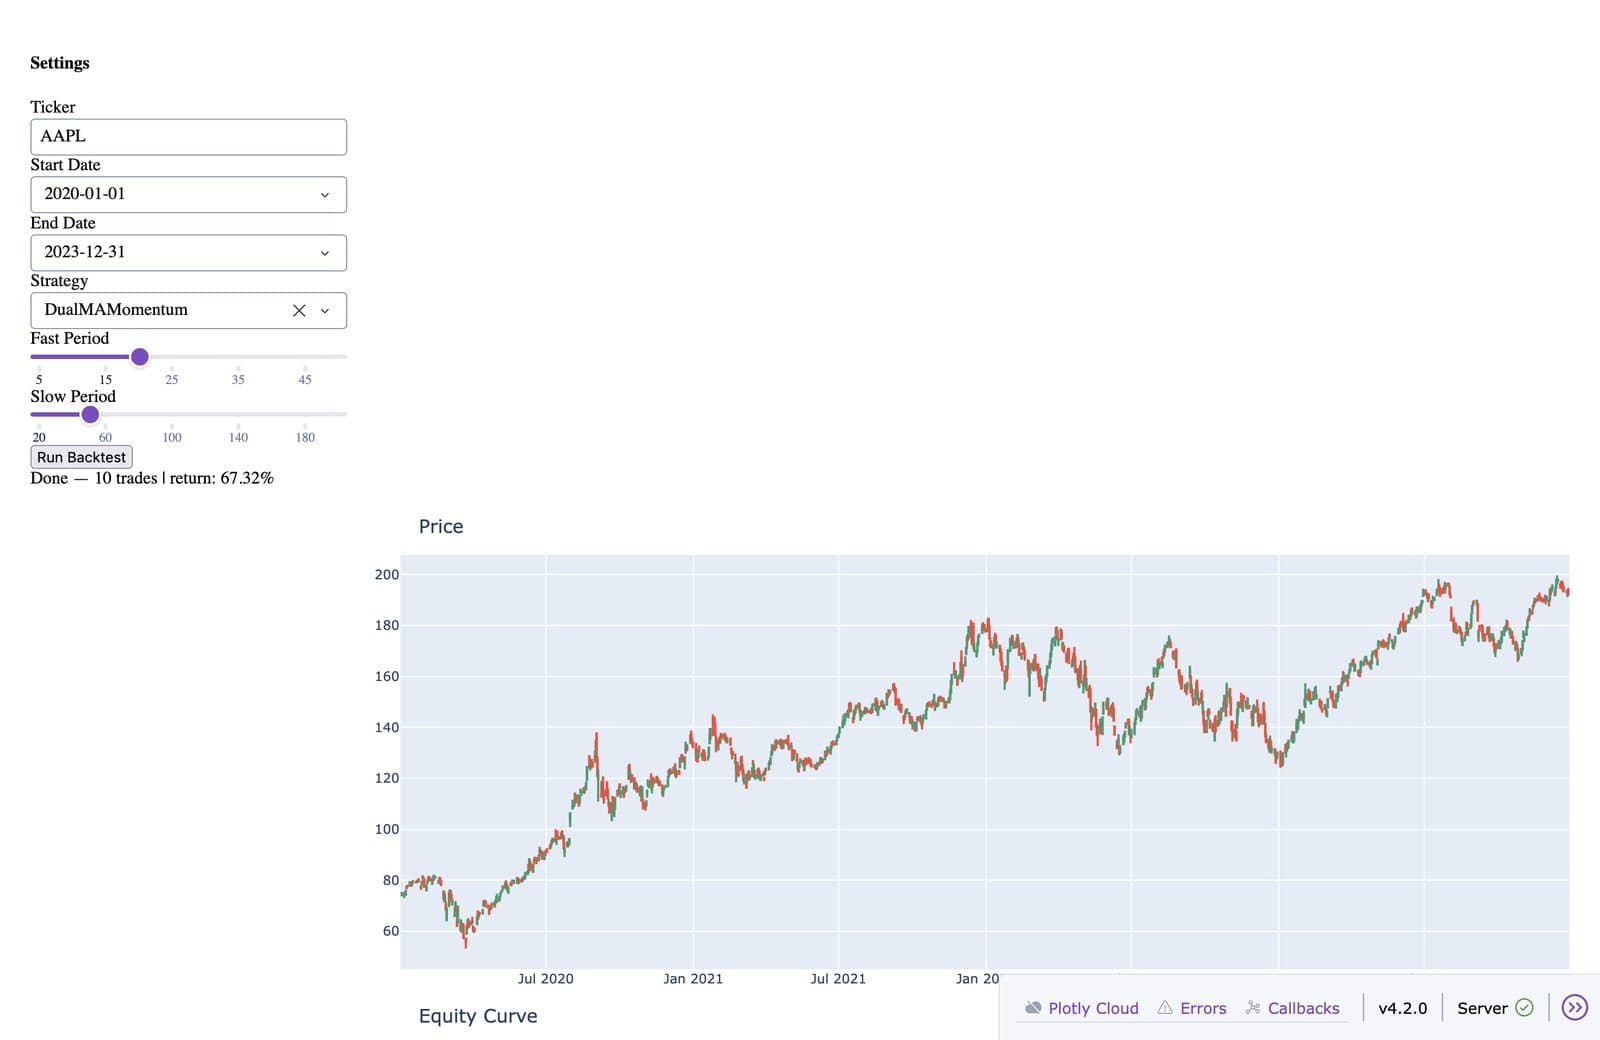
The first time I ran a serious backtest, the numbers looked great. A dual moving average crossover on AAPL from 2020 to 2023, fast period 20, slow period 60. Ten trades, +67% return. I thought I had found something.
I had not. I had found a pattern that fit one ticker over one window, and it told me almost nothing about what would happen next.
Three things that made it fake
First, I had grid-searched every combination of fast and slow periods and picked the best one using the full history. I was asking which parameters would have been best in hindsight, then using that answer to judge the strategy.
Second, there were no transaction costs. Real trades pay commission and slippage, and small costs compound across a few years.
Third, I measured performance on the same data I had optimized on. That is not validation. That is memorization.
What I built instead
The framework now has a walk-forward splitter. It takes a training window and a test window, grid-searches parameters on the training window only, then runs those exact parameters on the test window it has never seen. Then it slides forward by one test window and repeats.
Every trade pays 0.1% commission and 0.05% slippage by default. Price data comes from Yahoo Finance with Alpha Vantage as a fallback, gets cached in SQLite so I am not hitting the API on every run, and is validated with Pydantic before a strategy ever sees it. Strategies run on Backtrader: a moving average crossover for momentum and a Bollinger Band strategy for mean reversion.
There is a Plotly Dash dashboard where you can change the ticker, dates, strategy, and parameters and watch the equity curve update. And there are 53 tests, because I wanted to be able to trust the numbers.
What the numbers look like now
I ran a walk-forward test on AAPL from 2014 to 2023 using the moving average crossover with full trading costs. That gave seven folds, each training on 750 trading days (about three years) and testing on the following 250 (about one year). Stitched together, the seven test years have a Sharpe ratio of 0.86. The average in-sample Sharpe was 1.18.
The headline number hides a lot of movement. Individual test years range from -0.84 to 1.98, and the best parameters change from fold to fold. That instability tells me more than 0.86 does. Two folds show exactly 0.00 because the strategy chose 100 and 200 day moving averages, which spend most of a one-year test window warming up and barely trade.
An earlier version of this page said 0.74. When I went to reproduce it, I could not, and I found out why: the walk-forward optimizer was missing an import and had never actually run. I fixed it and added a script to the repo, so running python walk_forward_report.py gives you the same table I got.
Where I would take it next
First, give each test window some earlier price history to warm up its indicators, so a long moving average is not penalized just for needing time to start. Second, compare against simply buying and holding AAPL over the same years. AAPL had a very strong decade, and a strategy only matters if it beats doing nothing.
Further out, I am reading Advances in Financial Machine Learning by Lopez de Prado, specifically the chapter on combinatorial purged cross-validation. A single walk-forward path tests one sequence of periods. That method tests many, which would show how much of the 0.86 is luck.
I wrote more about this in Why Your Backtest Is Lying to You.